Plug-In Hybrid Paradox: Manufacturers Embrace Them, U.S. Shoppers Not Yet Fully Convinced
E-Vision Intelligence Report
September 2024
Key Findings
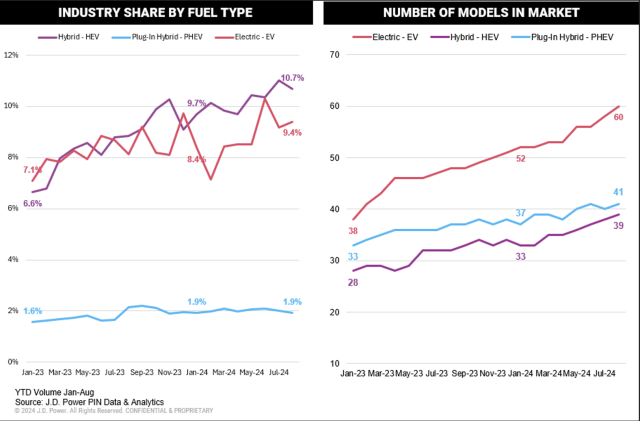
- Plug-In Hybrid (PHEV) Market Share Remains Stubbornly Low: Despite recent efforts by manufacturers to pivot to PHEVs as a bridge to full EV adoption, PHEV market share remains below 2% of the total automobile market. This compares with 9.4% for battery electric vehicles (BEVs) and 10.7% for hybrid vehicles (HEVs). Meanwhile, the total number of available PHEV models in the market (41) is larger than that of HEVs (39).
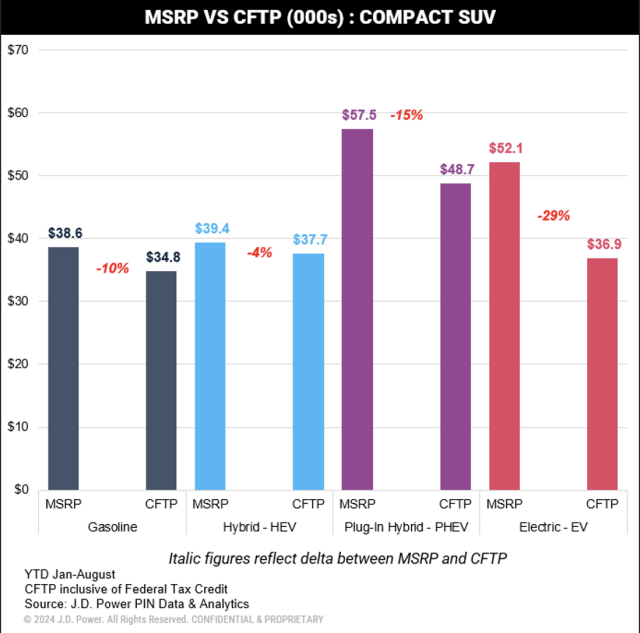
- Large Gap Emerges Between PHEV and BEV Purchase Prices: PHEVs are significantly more expensive to purchase than BEVs or HEVs. The average customer-facing transaction price (CFTP),[1] for a PHEV in the compact SUV category is $48,700. That compares with an average CFTP of $37,700 for a HEV and $36,900 for a BEV in the compact SUV category.
- PHEVs Missing the Mark on Customer Satisfaction: Overall customer satisfaction with PHEVs has been significantly lower than BEVs. Overall satisfaction with PHEVs is 669 (on a 1,000-point scale), while mass market BEVs (716) and premium BEVs (738) score significantly higher.
Executive Summary
By now, it is no secret that the big obstacle keeping shoppers from broad adoption of EVs is range anxiety. Consistently, across every study JD Power has conducted to evaluate customer experience with EVs, five of the top 10 reasons people give for rejecting an EV are focused on things like lack of charging station availability, limited driving range, time required to charge, and other charging- and infrastructure-related concerns.
The auto industry’s solution has been something of a compromise. In the past year, virtually every major automaker has made a pivot to PHEVs as a bridge between gasoline-powered vehicles and fully electric vehicles. On paper, it makes a ton of sense. In reality, it’s creating some new challenges.
This E-Vision Intelligence Report dives into key data points trending in each monthly JD Power EV Index update, along with other data points gathered from JD Power studies and pulse surveys, to spotlight emerging trends and important shifts in consumer sentiment.
PHEVS Not Moving the Needle on Sales
Despite heavy marketing pushes and high-profile introductions of new models, PHEV sales are not yet making a significant dent in total auto industry market share. Through August, PHEVs represented just 1.9% of total vehicle sales, which is down slightly from July. That compares with 9.4% market share among BEVs and 10.7% among HEVs.
In terms of vehicle availability, there are currently 41 different PHEV models available in the U.S. market. By comparison, there are 39 HEV and 60 BEV models currently available.
At What Cost Charging Independence
PHEVs have been widely embraced by the automotive industry as a bridge to meeting ambitious fleet emissions targets while also easing consumers into the EV transition by removing range anxiety from the ownership equation. It also doesn’t hurt that they are able to sell them at a significant premium to BEVs and HEVs.
On average, the CFTP for a compact SUV PHEV sold in January-August of 2024 was $48,700, which is 24% higher than the average real-world transaction price for a comparable BEV ($36,900). HEVs, which are most similar to PHEVs from a mechanical and production cost standpoint, have an average CFTP of $37,700 in the compact SUV category during the same period.
When viewed through the lens of total cost of ownership, which factors in things like fuel and maintenance costs, BEVs are just 1% cheaper to own over a 5-year period than all other fuel types.
Customer Satisfaction: A Critical Missing Link
Perhaps the biggest concern surrounding the auto industry’s pivot to PHEVs is the overall lack of customer satisfaction among the people who are buying these vehicles. Although they are being pitched as the best of both worlds, when it comes to customer experience PHEVs are starting to look like a compromised solution.
According to the latest updates to the JD Power U.S. Electric Vehicle Experience (EVX) Ownership Study,SM overall customer satisfaction with PHEVs has been significantly lower than BEVs. Overall satisfaction with PHEVs is 669 (on a 1,000-point scale), while mass market BEVs (716) and premium BEVs (738) score much higher. Among the challenges PHEV owners experience are higher-than-expected ownership costs associated with vehicles that have two different power sources, each with its own maintenance and fueling requirements. Also, since PHEVs are not discernably different in terms of style and design from their gasoline-powered counterparts, yet come at a steep premium, many consumers are not seeing a big enough difference in overall ownership experience to make them feel they are getting enough value for their money.

Methodology
This JD Power E-Vision Intelligence Report is based on data and insights from the JD Power EV Index, the JD Power EV Retail Share Forecast, the JD Power 2024 U.S. Electric Vehicle Experience (EVX) Ownership Study, the JD Power 2023 U.S. Electric Vehicle Experience (EVX) Public Charging Study and the JD Power U.S. Electric Vehicle Consideration (EVC) Study. The JD Power EV Index is an analytics tool to benchmark the growing EV market in the United States. It tracks millions of data points aggregated into six categories—interest, availability, adoption, affordability, infrastructure and experience—to evaluate the progress to parity of EVs with gas-powered vehicles in the U.S. Each month, the JD Power electric vehicle practice will analyze these data points, and others to spotlight emerging trends and important shifts in consumer sentiment that are helping to define the fast-moving EV marketplace.
Find out More
This report was authored by Elizabeth Krear, vice president, electric vehicle practice; Brent Gruber, executive director, electric vehicle practice; and Kristen Richter, senior manager, electric vehicle practice. The JD Power E-Vision initiative is a company-wide program focused on maximizing JD Power industry-leading EV data, analytics, insights and solutions. Please contact us at the numbers below to connect with the authors or to learn more about the underlying research.
Media Contacts
Shane Smith; East Coast; 424-903-3665; [email protected]
Geno Effler, JD Power; West Coast; 714-621-6224; [email protected]
[1] Consumer facing transaction price is the negotiated vehicle price less customer-facing incentives and includes the Federal Tax Credit.