Quarterly Share of Wallet Tracker: TV, Internet and Wireless
Q1 2025
As part of its ongoing analysis of customer experience with cable television, streaming, internet and wireless service providers, JD Power tracks the average prices customers report paying for these services nationwide. This average price data is tracked in four waves over the course of the year, which are roughly in line with calendar quarters. The following are key highlights from the Q1 analysis.
Key Findings
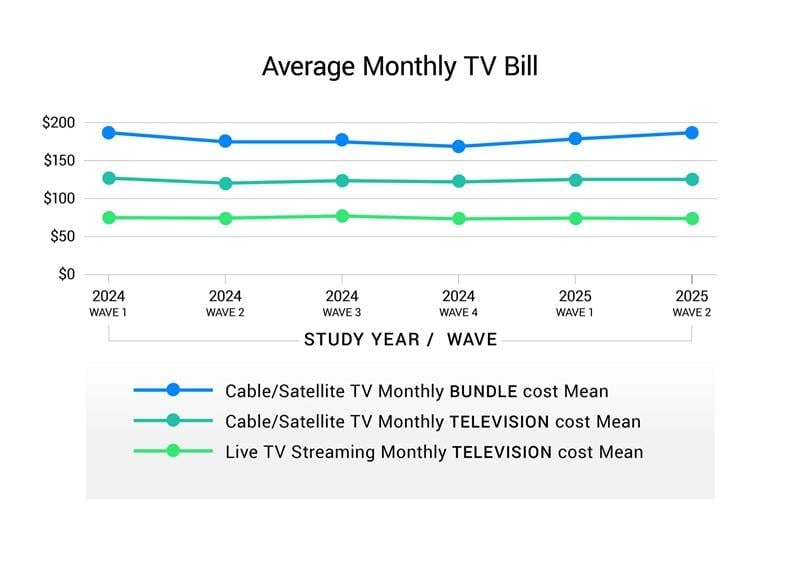
Cable and Streaming Costs Rise in Q1: The average amount paid for a monthly cable or satellite television bundle was $187.99 through January of 2025. That is $7.69 more than the average price at the end of October 2024, and $1.66 more than January 2024 figures. The average monthly cost for unbundled cable/satellite TV was $121.86 through January 2025, up from $120.93 in October 2024. The average monthly streaming bill was $73.47 in January 2025, up $0.38 from October 2024 and down $1.05 from January 2024.
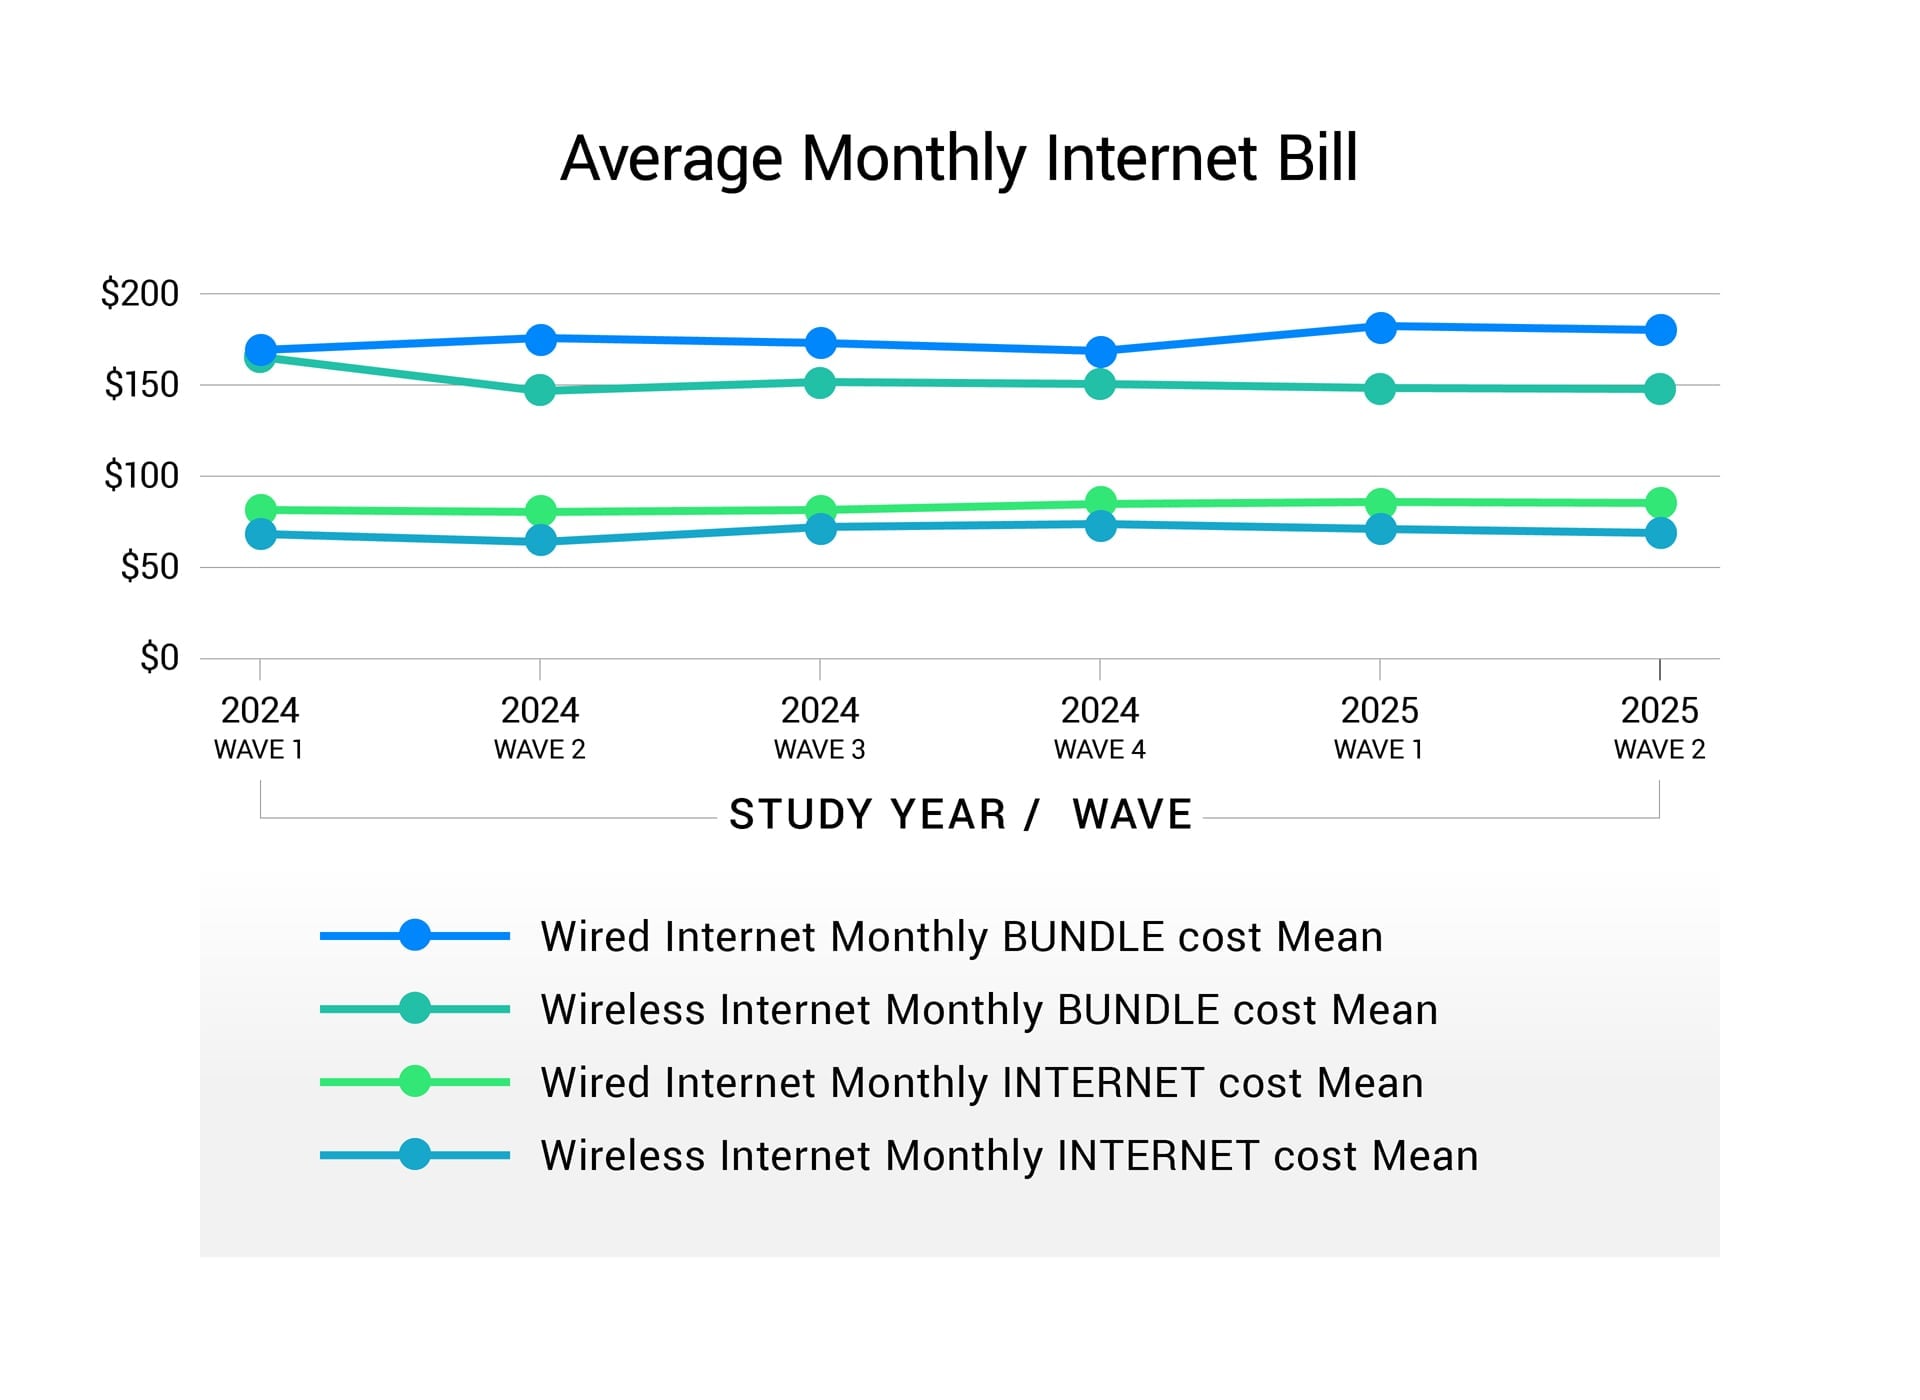
Unbundled Wireless Internet Costs Fall in Q1: The average amount paid for a monthly wired internet bundle was $170.06 through February of 2025. That is $0.92 more than the average price at the end of November 2024, and $7.93 more than February 2024 figures. The average monthly cost for unbundled wired internet was $83.35 through February 2025, up from $82.96 in November 2024. The average monthly wireless internet bundle was $145.40 in February 2025, up $0.19 from November 2024 and down $12.85 from February 2024. The average monthly cost for unbundled wireless internet was $71.53 in February 2025, down from $73.64 in November 2024 and up from $71.45 in February 2024.
Takeaways
Monthly cable, internet and wireless bills have come to occupy a significant share of consumers’ recurring household expenses, so any incremental movements on a quarterly or annualized basis can have a material effect on not only their overall satisfaction with their service providers, but also their purchasing power. While monthly bills have stayed largely steady over the past year, it will be important to see how they respond to current changes in the macroeconomic situation.
Methodology
This JD Quarterly Share of Wallet Tracker for TV, Internet and Wireless is based on data and insights drawn from the JD Power U.S. Television Services Provider Satisfaction Study, the JD Power Residential ISP Customer Satisfaction Study and the JD Power U.S. Wireless Customer Care Performance Study.
Find out More
This report was compiled by the technology, media and telecom at JD Power. Please contact us at the numbers below to learn more about the underlying research.
Media Contacts
Brian Jaklitsch; East Coast; 631-584-2200; [email protected]
Geno Effler, JD Power; West Coast; 714-621-6224; [email protected]