E-Vision Intelligence Report
November 2023
EV Adoption Trends: Not as Simple as Current Dealer Inventory Might Suggest
Key Findings
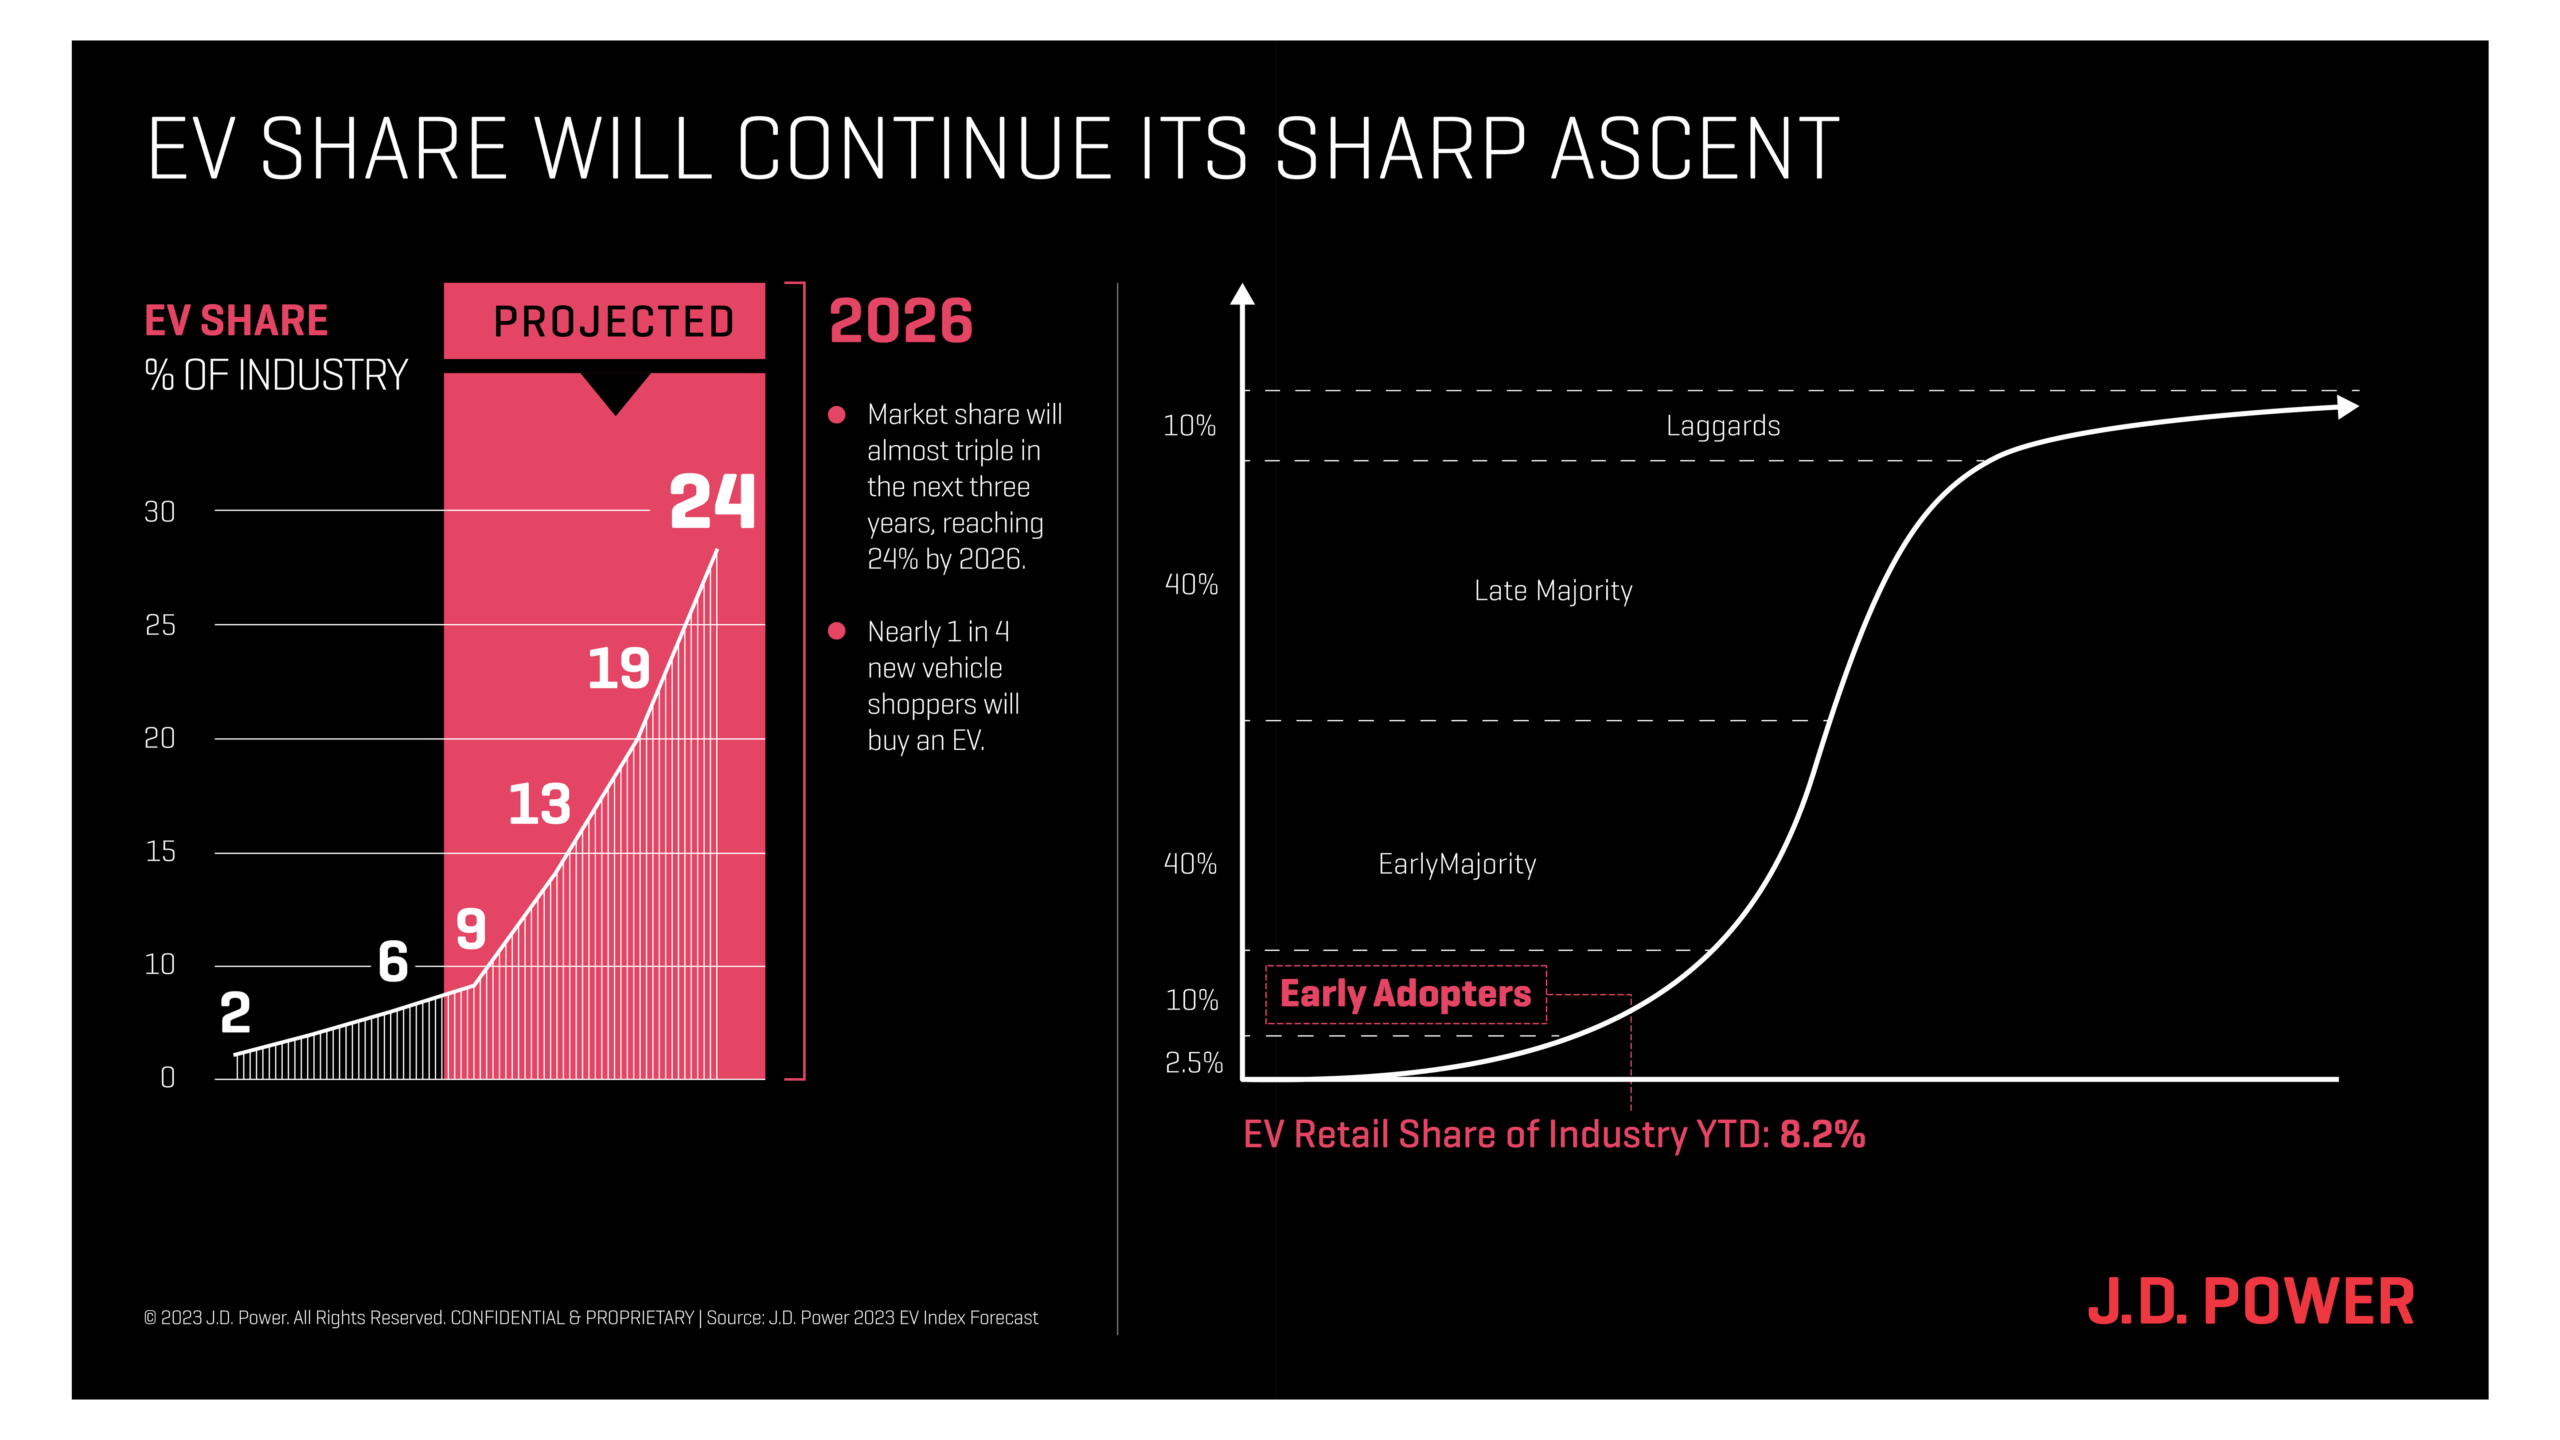
- EVs Still in Early Adopter Phase: New electric vehicle (EV) sales accounted 8.2% of total new-vehicle sales through October 2023, which is up from just 2.6% in 2020. While that is significant growth, it still represents a nascent market of early adopters. More notable is the fact that EV consideration, as measured by the number of consumers who say they are “very likely” to consider an EV for their next purchase or lease, has grown 3.3 percentage points in the last month alone to reach 29.2%. JD Power projects that EV sales will reach 13% market share by the end of 2024 and 24% total market share by 2026, putting the EV market firmly in the “early majority” phase of adoption.
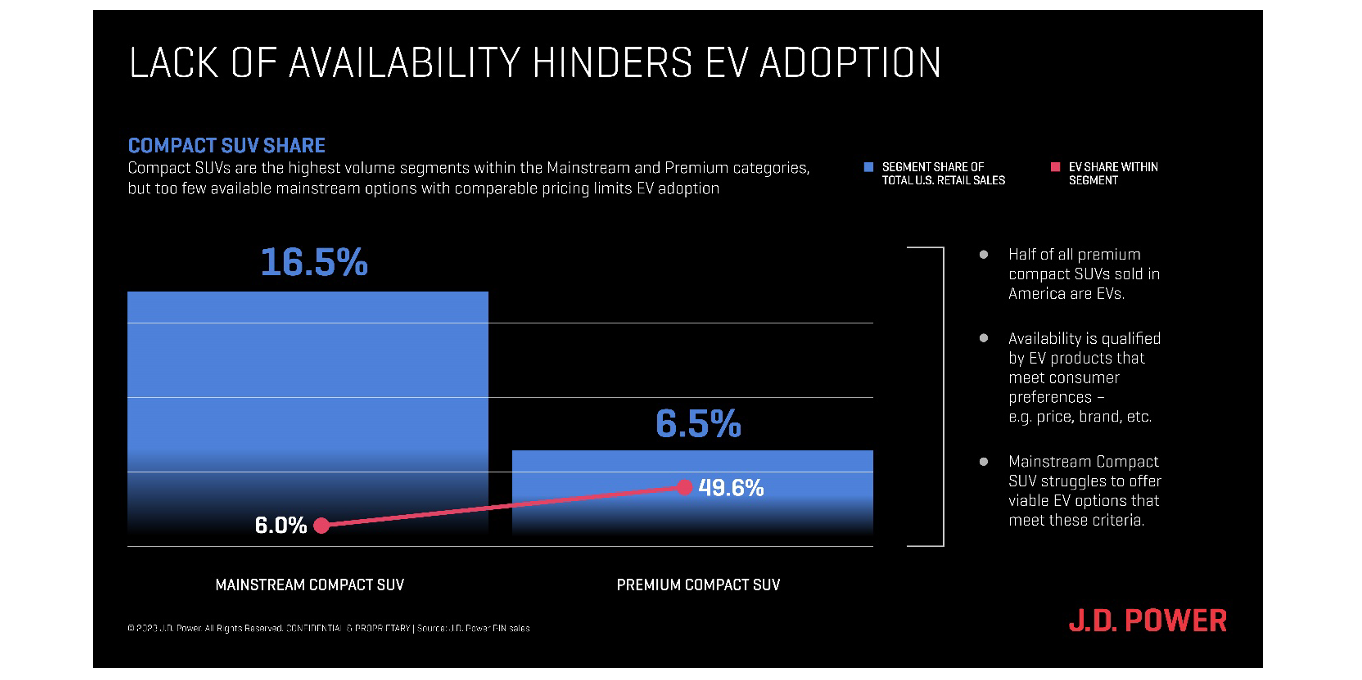
- The Missing Mass Market: Availability and affordability are among the biggest factors influencing mass EV adoption but right now there is a lack of viable options in the biggest mass market segments. The largest segment in the industry is mainstream compact SUV, which commands nearly 17% of total industry share. Within this segment, EVs only account for 6% of total sales. Compare that with the compact premium SUV segment, which accounts for just 6% of total retail sales, and yet EVs account for nearly 50% of all sales in the segment.
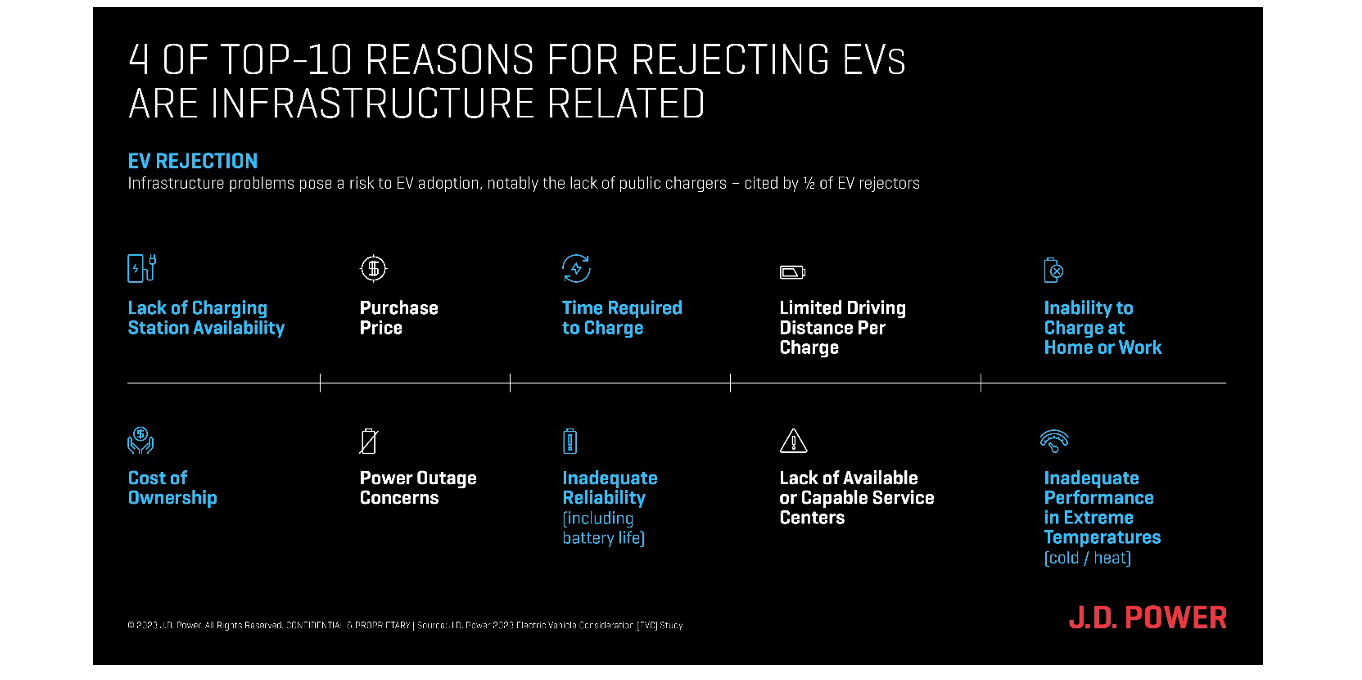
- A Different Type of Sale: EVs are taking dealers longer to sell than their internal combustion engine (ICE) counterparts, which reflects the unique challenges consumers face when considering an EV purchase. Currently, 7 of the top 10 reasons for consumers to reject an EV are issues that do not exist in ICE vehicles, including lack of charging station availability; time required to charge; limited driving distance; and inadequate performance during extreme temperature.
Executive Summary
To read the headlines and social media chatter during the past month or so, one might think consumers had suddenly turned their back on EVs: “EVs are piling up on car lots across the country.” “EV inventories increased more than 500%.” “EVs are sitting on dealer lots for much longer than gas-powered vehicles.” However, that’s not necessarily the case. While there have been some speed bumps on the road to mass adoption of EVs, the recent trend in dealer inventory is more of a reflection of the technology adoption lifecycle and current product mix than it is a referendum on EVs.
In fact, according to JD Power data, the number of consumers who say they are “very likely” to consider an EV for their next purchase or lease, has grown 3.3 percentage points from September to October, reaching 29.2%, its highest level of the year.
This E-Vision Intelligence Report dives into key data points trending in each monthly EV Index update, along with other data points gathered from JD Power studies and pulse surveys, to spotlight emerging trends and important shifts in EV consumer sentiment.
Seeing the Forest for the Trees
The EV inventory and sales stats that have been dominating the news cycle for the past month are true. EV inventories have increased, and they are taking longer to sell, on average, than gas-powered vehicles. However, those two data points in isolation belie a much more complex combination of market dynamics driven by everything from current product mix to price changes and incentives. Most notably, they downplay the fact that, at 8.2% of total new-vehicle sales market share, the EV adoption curve is still very much in the early adopter phase when any small blip in activity will show an outsized effect on short-term trends.
When viewed from a longer-term perspective, at current rates of adoption, EV market share will reach 13% of the total new-vehicle market by the end of 2024; 19% by the end of 2025; and 24% by the end of 2026. While dips will likely be seen along the way—similar to the sharp decline in EV sales that occurred from May to June 2023—when viewed over a longer time horizon, EV sales will continue to rise steadily.
The Missing Middle in the Current EV Mix
One key factor that will drive the transition from the “early adopter” to “early majority” phase of EV adoption will be the introduction of new models in the mass market segment. Currently, the EV marketplace is dominated by premium vehicles.
To put this in perspective, consider that Tesla, which is classified as a premium brand, accounts for 63% of total new EV sales and lease volume to date. Digging deeper into the data, we find that EVs account for just 6.0% of EV sales in the mainstream compact SUV segment, which is the biggest vehicle segment in the United States, accounting for 16.5% of total retail sales. By contrast, EVs account for 49.6% of sales in the premium compact SUV segment, which accounts for a smaller 6.5% of the total market.
That gap in EV accessibility becomes even larger when price is factored into the equation. The average retail price for a mass market compact SUV is $52,000, while the average retail price for a comparable gas-powered vehicle is $34,000, a gap of $18,000. In the premium compact SUV segment, however, the gap between average EV prices ($58,000) and comparable ICE prices ($54,000) is just $4,000.
Not Your Father’s Purchase Experience
Another factor that will heavily influence the pace of the EV transition will be a recognition among the various stakeholders in the EV market—manufacturers, dealers, electric utilities, and government agencies—that they all have an important role to play in consumer education.
Currently, four of the top 10 reasons for rejecting EVs are infrastructure-related and seven of the top 10 reasons for rejection do not exist for ICE vehicles. Concerns about lack of charging station availability, time required to charge, inability to charge at home or work, power outage concerns and concerns about inadequate performance in extreme temperatures are all new challenges that consumers have not had to deal with before. The sooner EV stakeholders focus on consumer education and significant investment in EV charging infrastructure, the sooner mass market consumers will follow.
Methodology
This JD Power E-Vision Intelligence Report is based on data and insights from the JD Power EV Index, the JD Power EV Retail Share Forecast and the JD Power U.S. Electric Vehicle Consideration (EVC) Study. The JD Power EV Index is an analytics tool to benchmark the growing EV market in the United States. It tracks millions of data points aggregated into six categories—interest, availability, adoption, affordability, infrastructure and experience—to evaluate the progress to parity of EVs with ICE vehicles in the U.S. Each month, the JD Power electric vehicle practice will analyze these data points, and others to spotlight emerging trends and important shifts in consumer sentiment that are helping to define the fast-moving EV marketplace.
Find out More
This report was authored by Elizabeth Krear, vice president, electric vehicle practice; Brent Gruber, executive director, electric vehicle practice; Stewart Stropp, executive director, electric vehicle practice; and Kristen Richter, senior manager, electric vehicle practice. The JD Power E-Vision initiative is a company-wide program focused on maximizing JD Power industry-leading EV data, analytics, insights and solutions. Please contact us at the numbers below to connect with the authors or to learn more about the underlying research.
Media Contacts
Shane Smith; East Coast; 424-903-3665; [email protected]
Geno Effler, JD Power; West Coast; 714-621-6224; [email protected]