
Best Cars and Trucks by Ratings
Research top, new vehicles for your needs. The latest J.D. Power ratings and reviews are used, and sometimes, this is from the previous model year.
Showing 1 to 6 of 6 top-rated vehicles
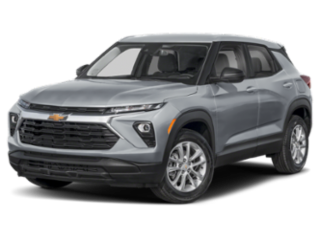
Sleek and modern styling; competitive pricing; wide range of standard features; available all-wheel drive; class-leading cargo volume
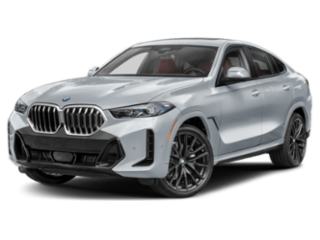
Distinctive coupe-like profile; responsive handling; refined powertrain options; premium technology features; practical crossover utility; advanced all-wheel drive system
Optional Equipment
Combined MPG: 17-26Head-Up DisplayParking AssistPower Lift GateLeather Steering WheelCooled SeatStability Control
Optional Equipment
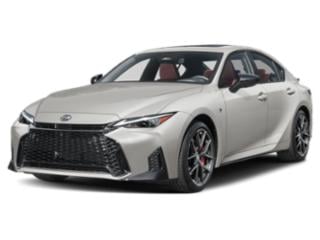
Combined MPG: 19-27Rear Cross Traffic AlertKeyless StartBrake AssistRear Window DefoggerAdaptive Cruise ControlWIFI Hotspot
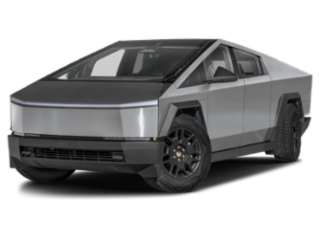
All-electric drivetrain; unique futuristic design; supercar acceleration; pickup bed; loaded with tech
Optional Equipment
Combined MPGe: 72-85Lane Departure WarningLane Keeping AssistStability ControlHeated Steering WheelAndroid Auto / Apple CarPlaySunroof/Moonroof
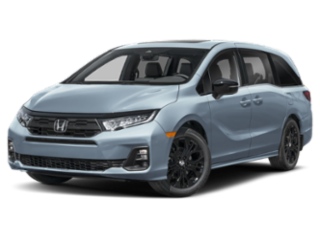
Bold styling details; responsive handling; living-room-on-wheels comfort and versatility; innovative cargo storage; smooth and refined ride; top safety pick
Optional Equipment
Combined MPG: 19-28Lane Departure WarningPower Lift GateHeated Mirror(s)Premium Sound SystemThird Row SeatingParking Assist
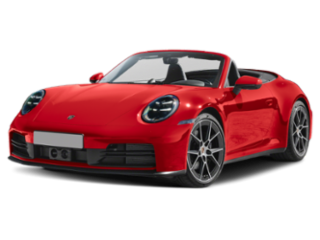
Distinctive design heritage; precise handling and stability; responsive flat-six engines; available all-wheel drive capability; open-roof configurations; efficient performance; well-appointed interior
Optional Equipment
Combined MPG: 17-25Traction ControlWIFI HotspotMemory SeatAndroid Auto / Apple CarPlayStability ControlHeated Seats
Note: JD Power ratings reflect our best available data, updated each September. For current model year ratings, we apply previous model year ratings until new consumer survey data is available in September. Learn more about our ratings methodology.
* Please use this rating with caution. The previous model year's rating was applied to this redesigned vehicle. These vehicles have the latest styling, technology, and other components, but are unproven in their first year and can be less reliable than their predecessor.